


Connecting Google Surveys to Data Studio
Google Surveys is one of the most recent additions to the lineup of products available within the Google Marketing Platform, allowing you to easily create and publish online surveys, either...


Google Surveys is one of the most recent additions to the lineup of products available within the Google Marketing Platform, allowing you to easily create and publish online surveys, either on your own site or across the web, to help better inform your decision making process with real consumer feedback. One of the strongest aspects of the Google Marketing Platform is the synchronisation and integration between each product, and we’ll pleased to say that a streamlined connection has been introduced between Google Surveys and Data Studio, our favourite data visualisation and reporting tool.
New Connector in Data Studio for Google Surveys
There are two immediate benefits of connecting the results of your surveys to Data Studio. Firstly, you can quickly and efficiently create a visual report of your survey results, which is brilliant for analysing the data and presenting your findings. Secondly, you can easily support or compliment the results of your survey with information from other data sources, such as Google Analytics or Google Ads. This means you can really focus on how exactly you can action the insights you’ve been able to identify from your survey.
Previously, creating a dashboard of your survey results would have involved exporting the data to a spreadsheet, formatting that spreadsheet in a way that was suitable and effective for Data Studio, and then connecting that sheet as a new data source. Thankfully, Google have added a native connector for Google Surveys within the Data Studio interface, and the process has been incredibly streamlined.
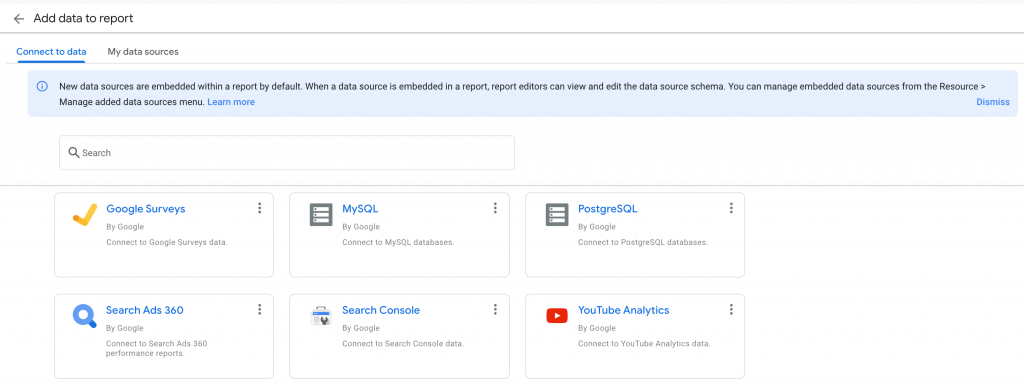
The difference between using a native connector in Data Studio and having to manually update a data source on a regular basis is night and day, as anyone who is familiar with using manual sources will attest to! This means that you can even connect your survey as it’s running, and view your results on an ongoing basis within Data Studio. As with any data dashboard, this opens up a huge number of visualisation options, interactivity, and customisation. Most importantly, it gives you complete control over how your results are presented.
The native data source for Surveys consists of 25 different fields by default, including demographic dimensions such as Age, Country, and Gender, as well as the variables within the survey itself, such as Question, Answer Position, and the Weight of any scaled responses. We won’t go into the complete list of dimensions and metrics here, but suffice to say you have a lot of options to play with!
Template Dashboard for Google Surveys
Another brilliant feature that’s been added to Google Surveys is the ability to immediately create and populate a report template within Data Studio, using the results of your own survey. This is perfect for anyone who is less familiar with creating visualisations or dashboards, and provides you with the a really useful foundation and starting point for your report. The sample report is even extensive enough that you may be happy to use it as your final report!
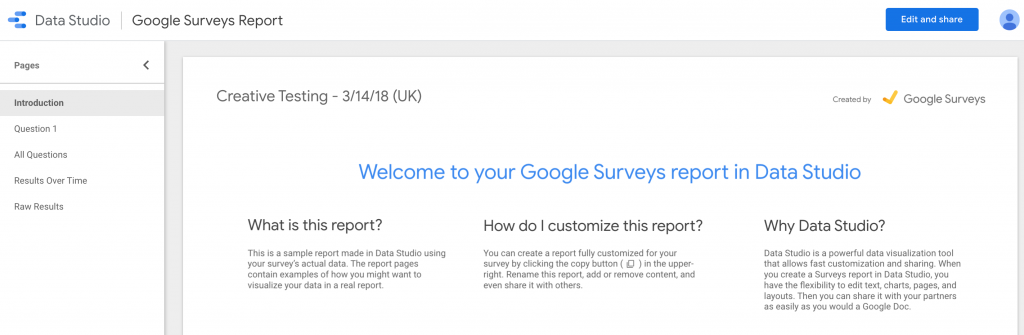
To generate and populate template, simply navigate to the survey you’d like to produce a report for, within the Google Surveys interface. Once you’ve clicked on the survey you’d like to explore, you should see a banner above the summary of results. There should be a button here in the top right that says “View Report in Data Studio”.

Clicking this button will open a new tab, and show you the template of your survey. You can navigate through different pages of this report using the menu on the left, and interact with various elements of the report, such as filtering data with the drop down menus and pie chart segments on the second page, titled Question 1.
Once you’ve explored the template, you can either jump in and make your own changes, whether you’d like to rearrange the layout, change the design, or add new features, or share the dashboard with colleagues. In either case, you’ll need to click the “Edit and Share” button, again in the top right. This will then generate your own Data Studio dashboard to edit and share as you wish, opening up all of the customisation options available in Data Studio.
Streamlined Integration Between Surveys and Data Studio
Integration is at the heart of the products in Google Marketing Platform, and this latest addition fully embraces this, allowing you to quickly combine two of the newest products available in the suite. For anyone already using Data Studio, a native connector for Surveys can offer a fantastic way to bring Google Surveys into your existing Analytics, Ads, and Social dashboards, and really helps to promote Surveys as a great tool that you can be utilising. For those who are already fans of Surveys, the streamlined integration with Data Studio really opens up the potential and scope of your surveys and market research with the huge variety of customisation and interactivity now available to you.
For more on Google Data Studio, follow us on Twitter @GlowMetrics, and check out our News & Insights section on the latest features and lesser known options in the Data Studio interface, to help you improve your reports and take your dashboards to the next level. If you have any questions about Google Surveys or Google Data Studio, please feel free to leave a comment below or get in touch at [email protected] and we’d be more than happy to help. Happy surveying, and happy reporting!

Posted by
Conor Ross
Conor specialises in data visualisation, designing and creating bespoke data dashboards and automated reports with Looker Studio. With a background in Psychology and Research Methods, he also works on projects focused on improving customer experience and website usability through A/B Testing and Personalisation.
Read more from Conor RossBrowse by Category
- Social Media
- SEM
- SEO
- Google Ads
Digital Marketing
- Google Analytics
- Google Tag Manager
- Google Opimize
Digital Analytics

Optimise your website and marketing campaign performance with Ireland’s leading digital analytics agency
Sign up to our newsletterEnjoyed reading this article? Find more like it below…
Posted by
Conor Ross
Apr 16th 2021
Google Analytics
5 min read
Sharing Reports and Dashboards in Google Data Studio
One of the great things about Data Studio is how easy it is to share your creations, data visualisations, and reports with others, making it a brilliant way to efficiently...


Posted by
Michael Wilson
Oct 22nd 2021
Digital Analytics Insights
4 min read
GA4 Event Tracking via GTM – Where are my Event Parameters?
The latest version of Google Analytics - GA4 - brings a whole new measurement framework. It also requires a whole new set of Google Analytics tags to be configured via...
Posted by
Conor Ross
Dec 3rd 2021
Google Analytics
6 min read
Reference Lines and Trend Lines in Looker Studio
Staying up to date with the latest features, additions and refinements to Google’s data visualisation platform, Looker Studio, can be a tough task. Rarely does a week go by without...
Leave a Reply