


Funnel Vision: GA4’s Funnel Exploration Reports
Understanding how users navigate your website is key, for both conversion optimisation and working towards improving your users’ experience. One way to do this is through GA4’s Funnel Exploration reports....


Understanding how users navigate your website is key, for both conversion optimisation and working towards improving your users’ experience. One way to do this is through GA4’s Funnel Exploration reports.
What is a Funnel Exploration Report?
The funnel exploration report lets you visualise the steps your users take when completing a task or conversion on your site, for example, making a purchase, signing up for a newsletter, or completing a form. The funnel exploration report lets you see how well your users are completing each step, as well as where users enter your funnels drop off points and areas of friction, revealing valuable insights.
Changes from Universal Analytics
Those who have used Universal Analytics previously may remember that UA also had a funnel report available, however there are some key differences between the funnel in UA and GA4’s funnel exploration report. The funnels in UA were accessed through the conversions report with three types of funnels available – Funnel Visualization, Shopping Behavior, and Checkout Behavior, with the latter two only available with Enhanced Ecommerce. These funnels were built on pageviews and sessions rather than users, which could be hard to understand and easy to misinterpret. Furthermore, funnels in UA could only have five steps which were based on URLs.
In contrast, GA4 only has one funnel exploration tool but it is significantly more powerful than what was available in UA. GA4’s funnel exploration is Event based and can have up to 10 steps.
Benefits of Using the Funnel Exploration Report
The insights gained from the funnel explorations can be helpful to understand where visitors are dropping off your funnel which can indicate issues on the site, and ultimately help inform the actions needed to reduce the number of abandoned customer journeys on your site.
You can also easily create audiences of users based on where they enter or exit the funnels you define, including creating remarketing audiences from your funnel steps to re-engage those users who have dropped off.
Limitations of the Funnel Exploration Report
The main limitation of funnel explorations is that you can only see where users are dropping off while on your site but not why they are exiting the funnel. This can make the report hard to understand if there are not any obvious issues on the site.
How to Create a Funnel Exploration Report
- Navigate to Explore: Once you are in your GA4 property, go to the “Explore” section in the navigation on the left-hand side.
- Select the Funnel Exploration Template: Choose the “Funnel exploration” template from the available options.

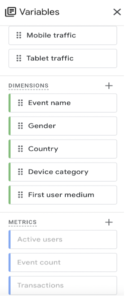
3. Select Your Dimensions: Select attributes of an event, product, transaction, user, etc from a list of available dimensions. This report is based on users as a default so you cannot add metrics.
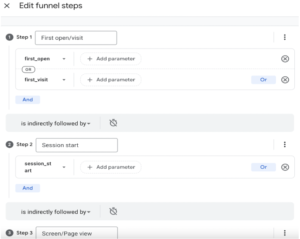
4. Define Your Funnel Steps: Specify the events that represent each step of your funnel by adding new steps and configuring the conditions. It’s crucial to define these steps in the correct order to accurately represent the user journey. You can add parameters to events here to be more specific, as well as choose whether steps are followed indirectly or directly, or within a certain time frame.
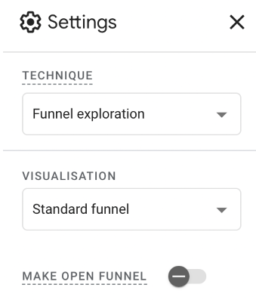
5. Configure Report Settings: Choose between a standard funnel visualization or a trended funnel visualization to see how funnel performance changes over time.
Standard Funnel

Trended Funnel

6. Choose an Open or Closed Funnel: Funnels are closed by default in the exploration reports – if a user enters the funnel after the first step they won’t be counted. Toggle on the switch to make the funnel open if you would like to count all users regardless of what stage they enter the funnel.
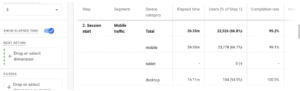
7. Advanced Steps: Switch on elapsed time to show how long (on average) it takes for users to move from one step to the next, and see what actions users took after completing each step of the funnel by adding the event name dimension under the next action category.

8. Analyse the Report: Examine the funnel visualisation to identify drop-off points.
You can save and share your funnel exploration with users in the same property. Your funnel will now be available in the “Explore” section!
Prefer Video? Watch On Youtube
Want to Learn About Digital Analytics?
For more digital analytics content, check out our blog on FBCLID (Facebook’s Click Identifier) and how it impacts GA4 data or How to Add a Google Ads Conversion Linker tag. If you have any questions or there’s anything else we can help with, please leave a comment below, or email [email protected].
You can also stay up-to-date by following GlowMetrics on Twitter or LinkedIn or by subscribing to our newsletter (link below) for the latest tips and news in the world of digital analytics and marketing.
Don’t forget to sign up for a FREE account on our Resource Hub to access a wealth of valuable resources, including exclusive Google Tag Manager how-to videos and insights!

Posted by
Hannah Magorrian
Hannah is a Digital Analytics Executive at GlowMetrics, working on creating data dashboards and assisting on wider analytics work across Google Analytics and Data Studio.
Read more from Hannah MagorrianBrowse by Category
- Social Media
- SEM
- SEO
- Google Ads
Digital Marketing
- Google Analytics
- Google Tag Manager
- Google Opimize
Digital Analytics

Optimise your website and marketing campaign performance with Ireland’s leading digital analytics agency
Sign up to our newsletterEnjoyed reading this article? Find more like it below…

Posted by
Joanne Kearney
Aug 19th 2019
Digital Analytics Insights
3 min read
How to use the Google Analytics Referral Exclusion List
Third Party websites appearing as referrals in your Google Analytics account? How to stop this and use the referral exclusion list in Google Analytics to attribute conversions to the original...


Posted by
Conor Ross
Apr 16th 2021
Google Analytics
5 min read
Sharing Reports and Dashboards in Google Data Studio
One of the great things about Data Studio is how easy it is to share your creations, data visualisations, and reports with others, making it a brilliant way to efficiently...
Posted by
Joanne Kearney
Mar 3rd 2017
Digital Analytics Insights
4 min read
From Fake News To Fake Metrics
In keeping with the trend in fake news, we've decided to look at some fake metrics this month. These are metrics that we would always warn people to carefully consider,...
Leave a Reply