


Creating Custom Groups in Looker Studio
If you are a seasoned Looker Studio user, you are probably already familiar with creating custom groups in your data using calculated fields and CASE statements - but did you...


If you are a seasoned Looker Studio user, you are probably already familiar with creating custom groups in your data using calculated fields and CASE statements – but did you know there is now an easier way?
Benefits of Grouping Data
Before we get into this useful new feature, if you have never created groups in Looker Studio you may be wondering why you would want to group data in your reports in the first place.
Grouping data in Looker Studio can be incredibly helpful for several reasons:
- Simpler Analysis – Grouping data allows you to organise similar or related data points together, making it easier to analyse and draw insights from the data. Instead of analysing individual data points, grouping enables you to analyse data at higher levels of granularity, which can reveal broader trends and patterns.
- Better Visualisation – Grouping data enables you to create more meaningful and insightful visualisations. By sorting data into custom groups, you can create charts and graphs that provide a clear and concise representation of trends and patterns within the data.
- Comparisons – Grouping data makes it easier to compare different groups or categories against each other, facilitating side-by-side comparisons that can reveal valuable insights.
CASE Function
Previously, we had to create a new calculated field and use the CASE function to create custom groups. The CASE function is best described as an ‘if this, then that’ function – when condition 1 is met then result 1 is returned, for example:

This syntax begins with ‘CASE’, then ‘WHEN’ clauses define the conditions to be met. When a condition is satisfied, the associated result is returned. If none of the conditions are met, the ‘ELSE’ result is returned. This simple example demonstrates splitting the ‘session default channel grouping’ dimension into two groups: organic and all others.
New Group Calculated Field Type
Thanks to a recent Looker Studio update, we can now create custom groups for dimensions without needing to develop CASE WHEN expressions in calculated fields, with the new Group calculated field type.
This new time-saving feature is more efficient, reducing effort when creating custom groups, and may be more approachable to newer or less experienced Looker Studio users as there is no need to code.
How to Create a Custom Group
To create your custom group, click to edit your data source. Click the blue plus sign to ‘add a field’ and select ‘add group’.

Select an existing field to group by from the drop-down menu and choose a name for your new dimension – this is the name that will show in your reports and must not be the same as an existing dimension. We’ll create the same groups as we have in the CASE example above.
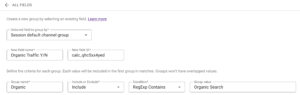
The next step is to define the criteria for each group by selecting a name, conditions and a group value. We have specified that if the session default channel group contains ‘Organic Search’, then it should be included in our ‘Organic’ group.

To add more groups for that dimension, click the ‘Add group’ button, and repeat the previous steps, or as we have done in this example, group the remaining values that don’t meet the group conditions together as ‘All Other’.
Click ‘Save’ and ‘Finished’. Your new group will now be available to use as a dimension in your dashboard!
Want to Learn More About Looker Studio?
For more on Looker Studio, check out our Guide To Using Filters and Using Comparison Metrics. If you have any questions or there’s anything else we can help with on Looker Studio, please leave a comment below, or contact us at [email protected].
You can also stay up-to-date by following GlowMetrics on Twitter or LinkedIn or by subscribing to our newsletter (link below) for the latest tips and news in the world of digital analytics and marketing.
Don’t forget to sign up for a FREE account on our Resource Hub to access a wealth of valuable resources, including exclusive Looker Studio how-to videos and insights!

Posted by
Hannah Magorrian
Hannah is a Digital Analytics Executive at GlowMetrics, working on creating data dashboards and assisting on wider analytics work across Google Analytics and Data Studio.
Read more from Hannah MagorrianBrowse by Category
- Social Media
- SEM
- SEO
- Google Ads
Digital Marketing
- Google Analytics
- Google Tag Manager
- Google Opimize
Digital Analytics

Optimise your website and marketing campaign performance with Ireland’s leading digital analytics agency
Sign up to our newsletterEnjoyed reading this article? Find more like it below…

Posted by
Cristian Mercado
Aug 10th 2018
2 min read
It’s beacon, not bacon!
Have you ever heard of a Beacon? Well neither had we, but now we have and this is how it looks! Google decided to send us a sample beacon to...

Posted by
GlowMetrics Staff
May 12th 2016
2 min read
GlowMetrics Awarded Google Analytics Certified Partner Status
We've some great news to share with you today, we have just been awarded Google Analytics certified partner status. Being a certified partner, we will be given insights into the...

Posted by
Georgia Sloan
Mar 28th 2024
Digital Analytics Insights
2 min read
The Discrepancy Between LinkedIn’s ‘New Followers’ Metric and Actual Page Growth
Have you been using LinkedIn's analytics to track your page's New Follower growth, only to find yourself scratching your head when the numbers don't quite add up? If so, you're...
Leave a Reply