


Adding Images as a Data Source in Looker Studio
Looker Studio offers a powerful way to visualise and analyse your data. But what if you want to go beyond numbers and charts and include images?


Looker Studio offers a powerful way to visualise and analyse your data. But what if you want to go beyond numbers and charts and include images? Looker Studio allows you to incorporate images directly into your reports as a data source, adding a whole new dimension to your storytelling. Here we have used it as part of a “Character Catalogue” using Animal Crossing data available on kaggle.com, but there are so many use cases for this!
Here’s how to add your images as a data source in seven simple steps:-
-
-
Click “Add Chart” and choose “Table.”

-
- Place the table onto your dashboard.

- In the chart settings tab under “SET-UP” delete any unnecessary dimensions and metrics.

-
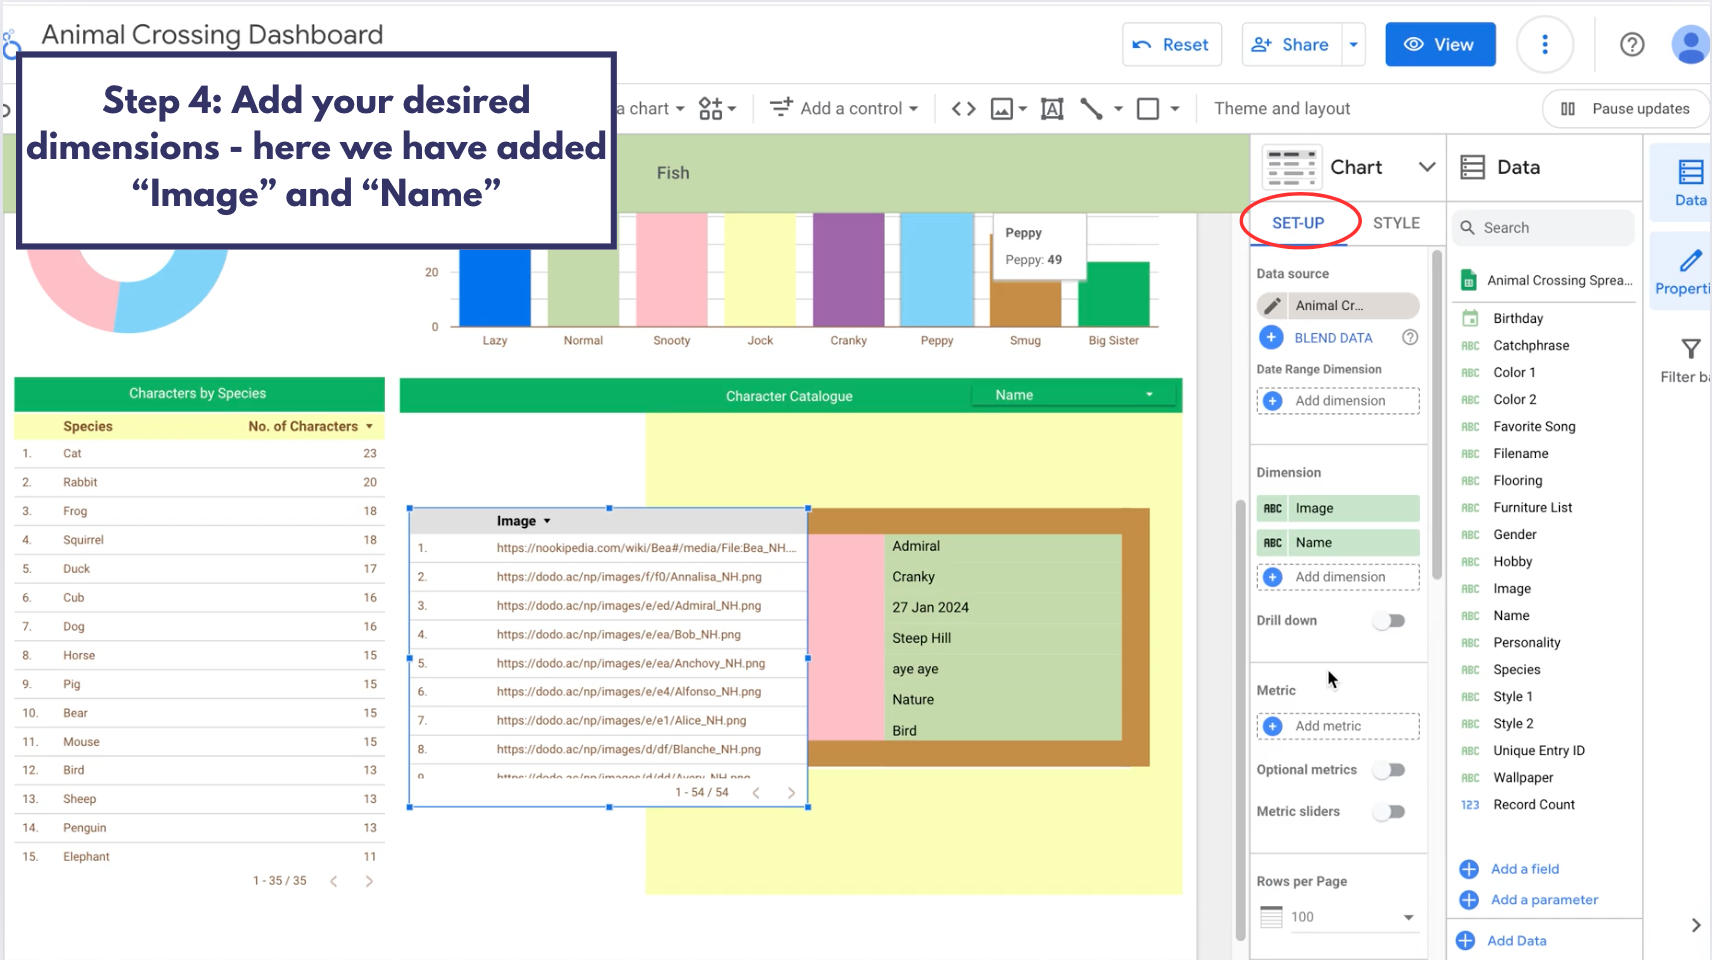
Add your desired dimensions – here we have added “Image” and “Name”.
-
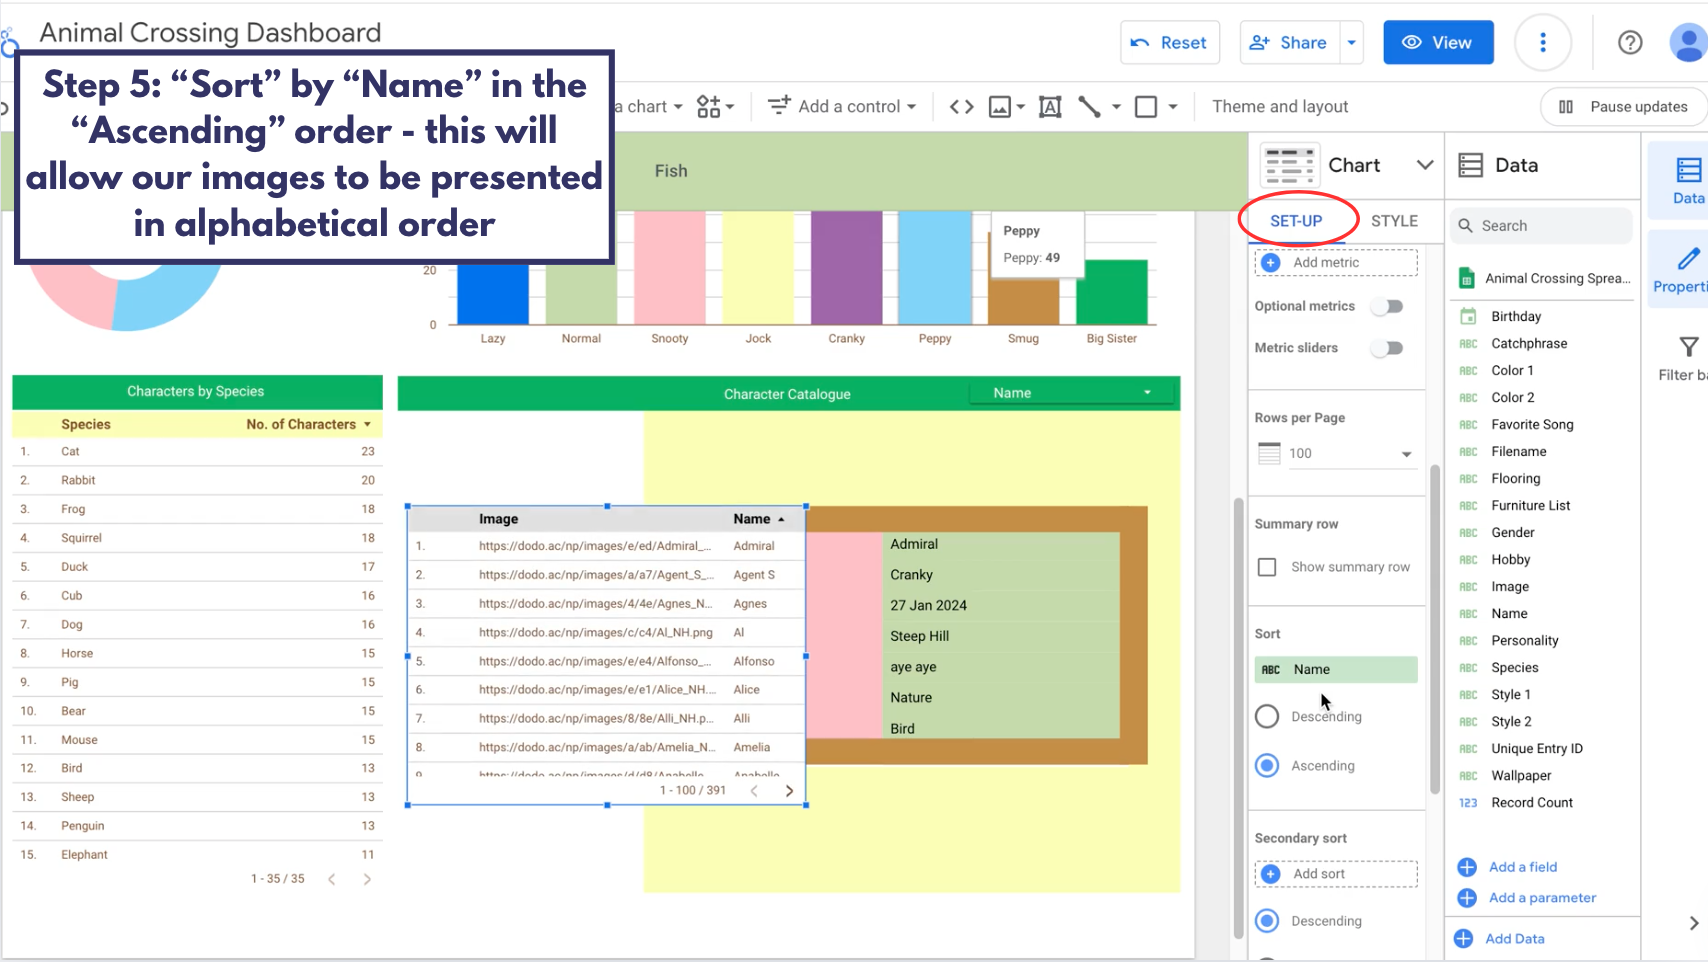
“Sort” by ”Name” in the ascending order – this will allow our images to be presented in alphabetical order.
The image values will likely first be populated as URLs as this is how they are presented in the underlying data set (in this case google sheets – see image below)
This “Sort” technique is the most applicable for this data set, your data set may need to be sorted differently to allow it to appear in the most appropriate manner.

-
To allow the URL to populate as an image – under “SET-UP” go to the image dimension and click “ABC” to edit.

-
Change the “Data Type” from URL to “Image”.


Now your table should be populated with actual images! Remember to adjust the table size and formatting for a cohesive dashboard design.

Posted by
Georgia Sloan
Georgia is a Digital Analytics Assistant who has recently joined GlowMetrics. She works on assisting with projects across Google Analytics and Data Studio, creating data dashboards and social.
Read more from Georgia SloanBrowse by Category
- Social Media
- SEM
- SEO
- Google Ads
Digital Marketing
- Google Analytics
- Google Tag Manager
- Google Opimize
Digital Analytics

Optimise your website and marketing campaign performance with Ireland’s leading digital analytics agency
Sign up to our newsletterEnjoyed reading this article? Find more like it below…

Posted by
GlowMetrics Staff
Oct 28th 2016
2 min read
Google Optimize – Google’s A/B, Multivariate & Redirect Testing Tool
Google recently released their new product, Google Optimize, their own tool which allows you to test variations of your site, see what works best for your visitors and in turn,...


Posted by
Michael Wilson
May 30th 2024
Digital Analytics Insights
4 min read
How To: Collect GCLID from Google Ads in GA4 via GTM
If you've been wondering how to store the GCLID parameter from your user's Google Ads clicks in GA4, this is the guide for you. If you've found your way here...
Posted by
Georgia Sloan
May 7th 2024
Digital Analytics Insights
3 min read
Using Report-Level Elements in Looker Studio
Tired of copying and pasting repetitive content across your Looker Studio reports? When you have elements that need to be on every page, it can feel like a chore to...
Leave a Reply